By Kate Douthat, third year PhD candidate in the graduate program of Ecology and Evolution at Rutgers. Kate’s research is examining the plant communities that have formed in urban stormwater systems. She is interested in the extensive stormwater infrastructure network in New Jersey and how we can use plants to improve water quality. Kate loves to share her enthusiasm about plants and to teach the public about the stormwater systems in our backyards. She has agreed to develop a series of informative blogs for the LRWP’s readers and will also lead our #booksfortheriver book club starting Fall 2019. You can see more of her writing about plants and water resources at katedouthatecology.com
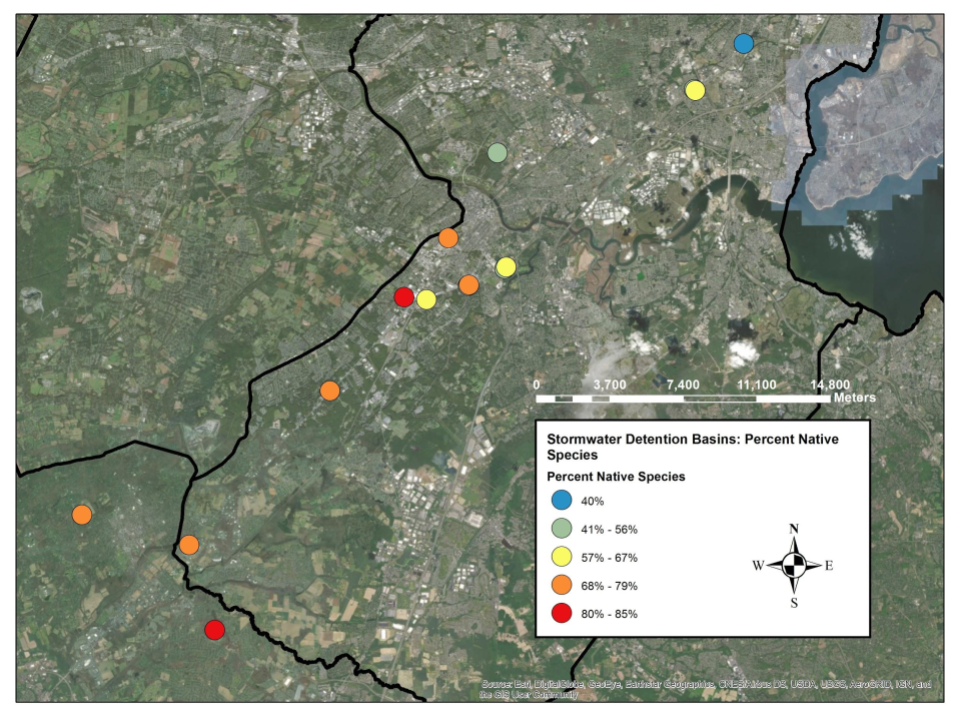
This map shows the location of each site and the percent native species in each basin. The map shows a trend for lower percentage native species at more northern sites, so location matters!
During the summer of 2018, I surveyed plants in stormwater detention basins throughout an urban and suburban area of central New Jersey. This study is aimed at improving water quality and wetland habitat by choosing the right plants for the job. Selecting appropriate sites for renovations and the choosing the best species to plant depends on many factors. Two important factors are the plants’ ability to survive in basin conditions and the natural tendency for certain plants to colonize basins regardless of what we plant there. One question I am addressing is how survival and colonization change depending on the surrounding landscape. Because catch basins at various locations receive different amounts of pollution and seeds, I expect to see different plants in different settings.
How does the surrounding landscape influence the plant community in a stormwater detention basin?
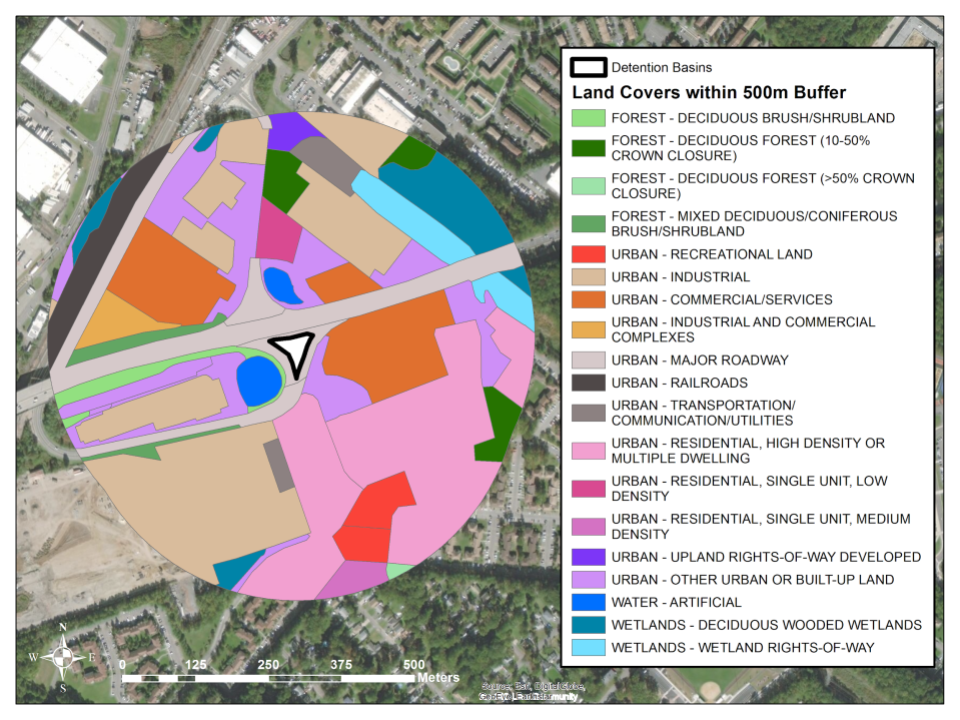
The adjacent land use and land cover influence wetland properties, including plant communities. Land cover is the type of stuff on the site, such as forest or roads. Land use is the activity that humans do on the site. Both factors affect plant communities. The surrounding landscape influences the plant community by the quantity and type of seeds available and by dispersal routes. One of the basic ways that plant communities are quantified is by the number of different species on a site, termed “species richness.” Paved roads around a wetland affect plant species richness and roads are particularly important dispersal routes for invasive plants. The proportion of native plants increases with forest cover in the surrounding area.
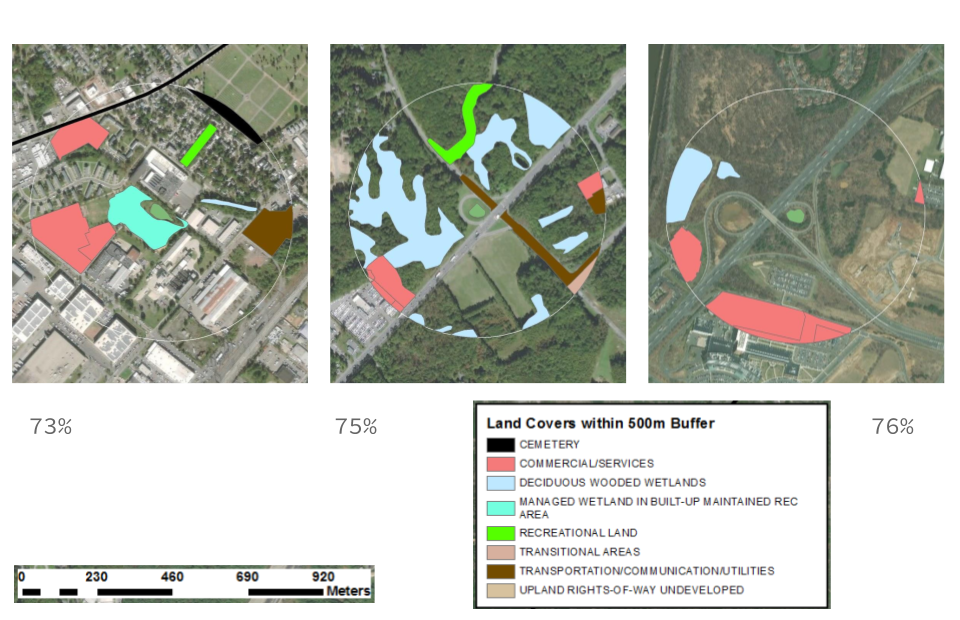
In this analysis, I am using the land use and land cover within 500 meters of each catch basin to explore relationships between adjacent land and the proportion of native species in the basin. I used a computer program to do exploratory regression. That technique takes each possible explanatory factor and tests the strength of the relationship between that factor and the factor of interest. In this case, the factors are land cover types and the percent native species at a site. I found that more adjacent commercial and service area leads to a lower percentage of native species in a catch basin. Transportation and utility areas, such as power line right-of-ways, also contributes to a lower percentage of native species. On the other hand, the percent of native species increases when a basin is surrounded by recreation area and wooded wetlands.
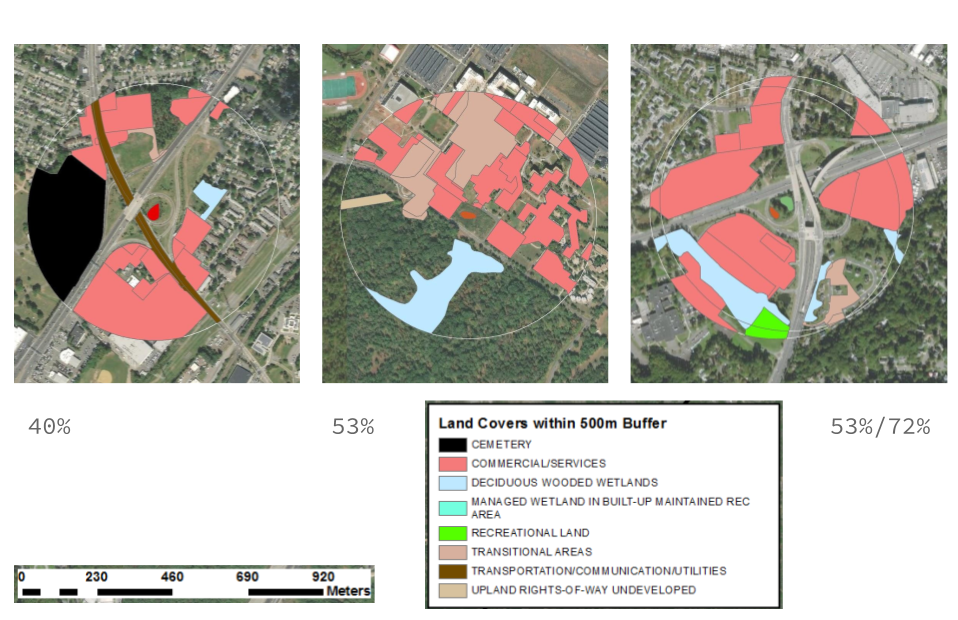
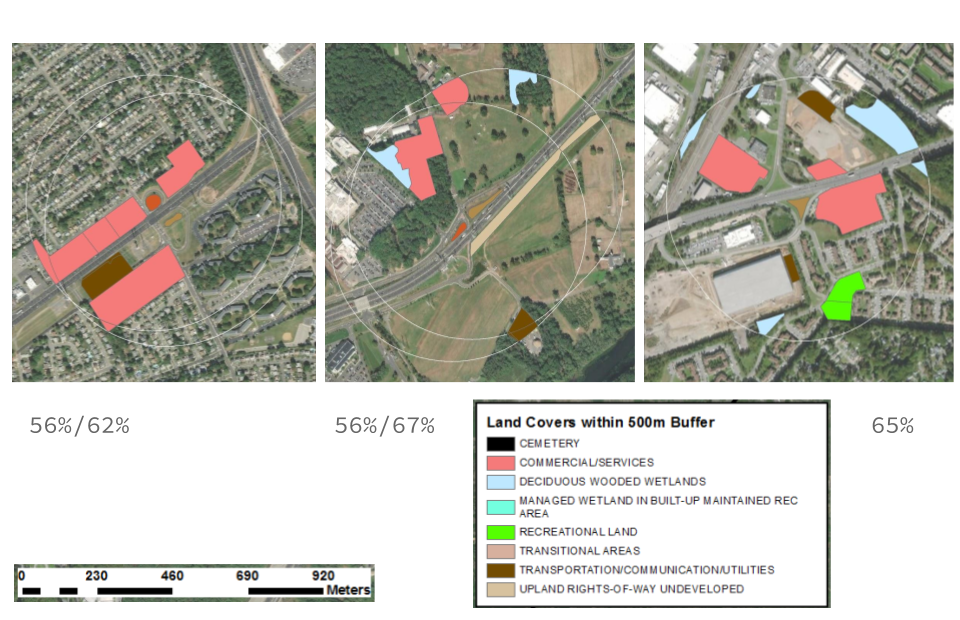
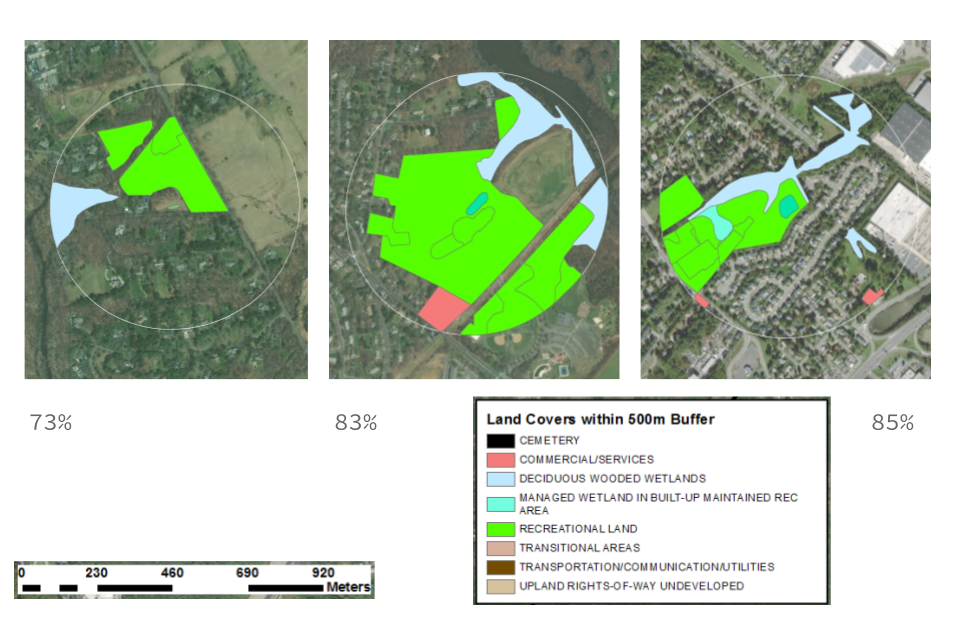
The following series of maps shows the areas around each catch basin. The maps are arranged from lowest percent native species to highest. In some cases there were two basins next two each other, so there are two numbers shown for the percent native species in each one individually. The land cover types with the strongest relationship to percent native species are colored. The reds and pinks are commercial or transitional areas, the light blues are wetlands, and the green is recreation area. (The names in the legends are the specific technical terms.)
The maps show that the amount of commercial or recreation area that surrounds a catch basin makes a big difference to the plants that live there. This result can help land managers decide which restoration goals are appropriate in different settings. For example, by the roadside, where there are more non-native species, a basin may be redesigned to filter pollution. Non-native species can perform this service as well as native species. However, in a park or recreation setting, where there are relatively more native species, a catch basin may be restored to include rare and sensitive native species. This analysis still needs fine tuning, but shows promise as a way to predict plant community characteristics based on the surrounding landscape.
Happy Summer! Save for on-going water quality monitoring, the LRWP is taking a break from events and meetings through August and the long hot summer days. This will give us plenty of time to dig into our water themed summer reading list inspired by Popular Science and the Strand bookstore. Happy reading – see you in September!
Water quality results are in for Thursday June 27, and with the recent dry spell we’ve had the news looks pretty good for a change! Hooray!
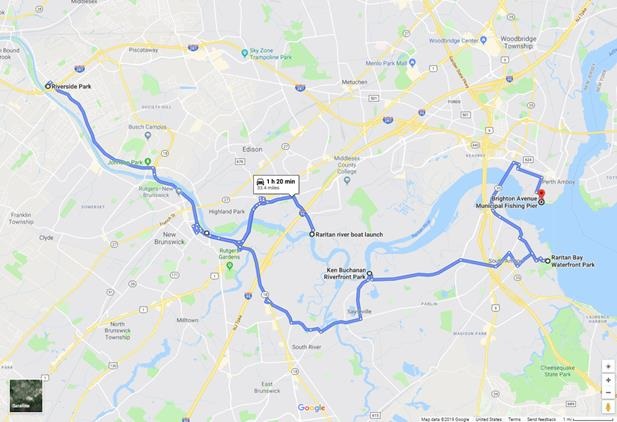
Enterococci results are reported in Colony Forming Units or CFUs. Enterococci results are reported in Colony Forming Units or CFUs. Suitable levels should not exceed 104 cfu/100mL. We are reporting on enterococci at six non-swimming beach public access sites along the Raritan River. See here for more information on our Summer 2019 monitoring program.
Enterococci levels are used as indicators of the possible presence of disease-causing bacteria in recreational waters. Such pathogens may pose health risks to people fishing and swimming in a water body. Sources of bacteria include Combined Sewer Overflows (CSOs), improperly functioning wastewater treatment plants, stormwater runoff, leaking septic systems, animal carcasses, and runoff from manure storage areas. Enterococci levels are often high after heavy or consistent rainfall.
Huge thanks to our the EARTH Center of Middlesex County, to Jesse Stratowski and his team at the Rutgers Boathouse, and to our wonderful volunteers.
**Please note: these results are preliminary and awaiting Quality Control.** Next week we will report monitoring results on Wednesday July 3 to help you make plans for water sports and activities.
Enterococci levels are used as indicators of the possible presence of disease-causing bacteria in recreational waters. Such pathogens may pose health risks to people fishing and swimming in a water body. Sources of bacteria include Combined Sewer Overflows (CSOs), improperly functioning wastewater treatment plants, stormwater runoff, leaking septic systems, animal carcasses, and runoff from manure storage areas. Enterococci levels are often high after heavy or consistent rainfall.
Enterococci results are reported in Colony Forming Units or CFUs. Enterococci results are reported in Colony Forming Units or CFUs. Suitable levels should not exceed 104 cfu/100mL. Enterococcus results, times and coordinates for June 20, 2019:
For those of you making plans to be on the water, see below for Enterococcus results for monitoring conducted on June 13, 2019. Results are reported in Colony Forming Units or CFUs. Please note that while we follow quality control measures, the real-time nature of data delivery means that EPA has not reviewed, and these are not technically quality controlled.
Enterococci levels are used as indicators of the possible presence of disease-causing bacteria in recreational waters. Such pathogens may pose health risks to people fishing and swimming in a water body. Sources of bacteria include Combined Sewer Overflows (CSOs), improperly functioning wastewater treatment plants, stormwater runoff, leaking septic systems, animal carcasses, and runoff from manure storage areas.
Enterococci results are reported in Colony Forming Units or CFUs. Suitable levels should not exceed 104 cfu/100mL.
Site Name
Time sampled
Enterococcus (CFU)
Riverside Park, Piscataway
8:45
TNTC
Rutgers Boathouse, New Brunswick
9:45
2,600
Edison Boathouse
10:22
150
Ken Buchannan Waterfront Park, Sayreville
11:03
250
South Amboy Waterfront Park
11:44
51
2nd Street Park, Perth Amboy
12:12
TNTC
TNTC stands for Too Numerous To Count, or >60,000. Please note that these results are in colony forming units (CFU). These results are preliminary and pending Quality Control.
Article by Howard Swerdloff, New Brunswick Environmental Commission
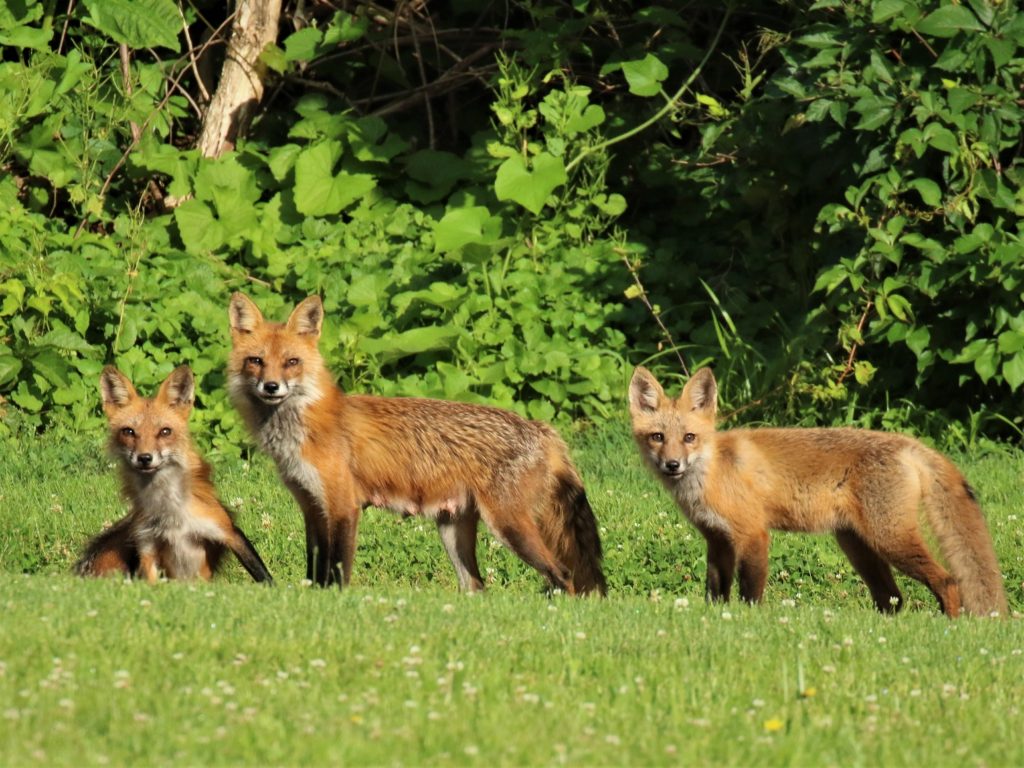
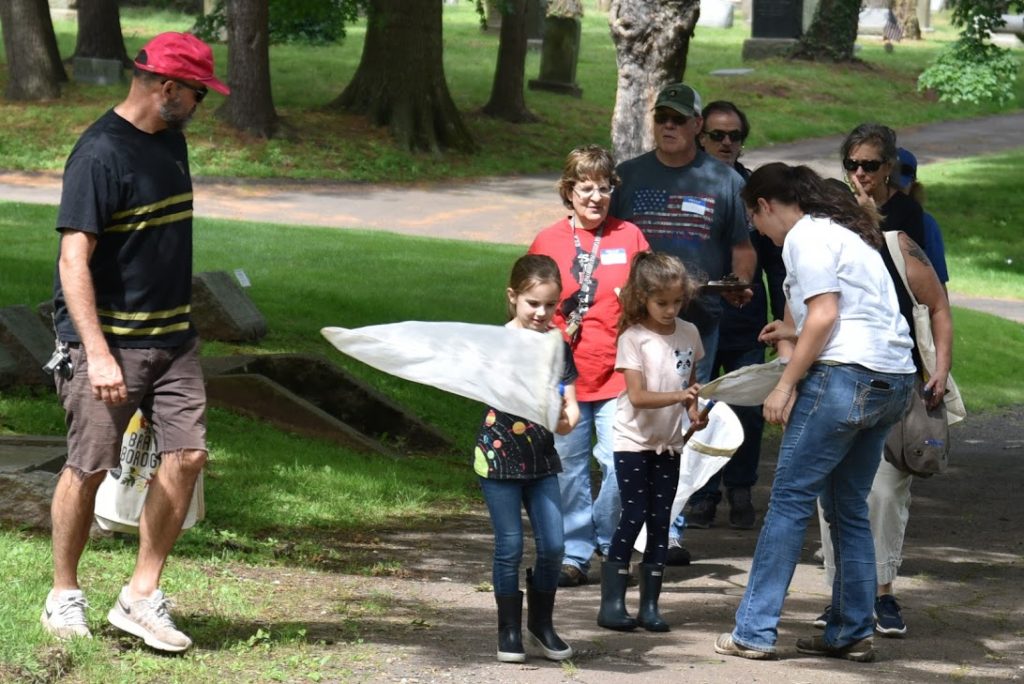
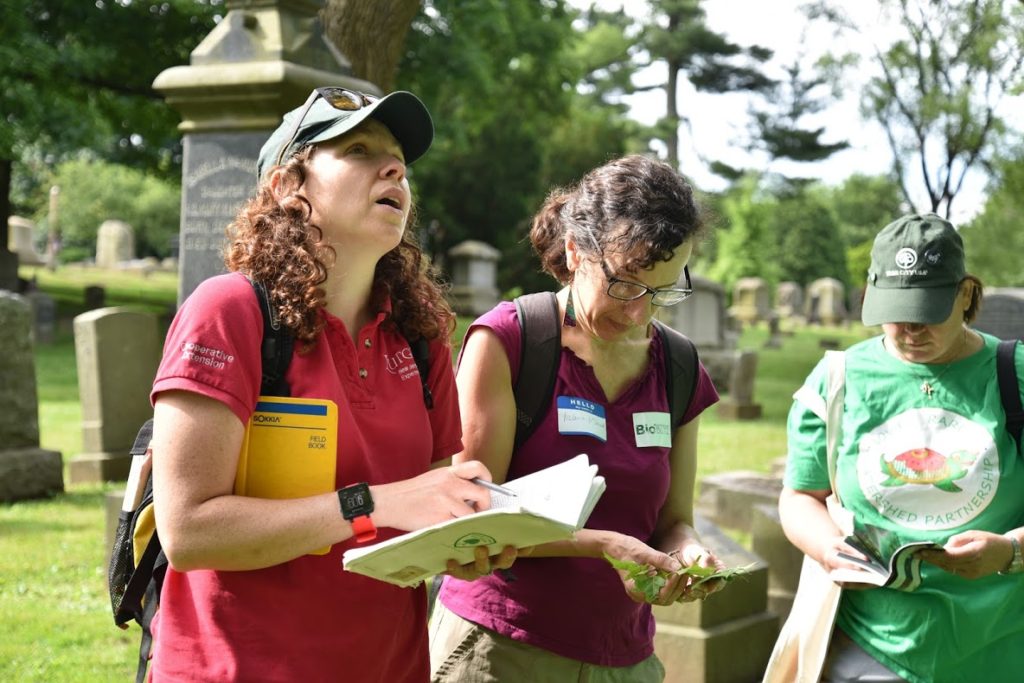
On Saturday June 8, 2019, the Elmwood Cemetery hosted their first annual “BioBlitz.” (A“BioBlitz” is an event that focuses on finding and identifying as many species as possible in a specific area over a short period of time.) The event was sponsored by the Lower Raritan Watershed Partnership (LRWP), the Americorps Watershed Ambassadors Program, New Brunswick Environmental Commission, North Brunswick Environmental Commission, and the Elmwood Cemetery.
Photo credit: Roger Dreyling
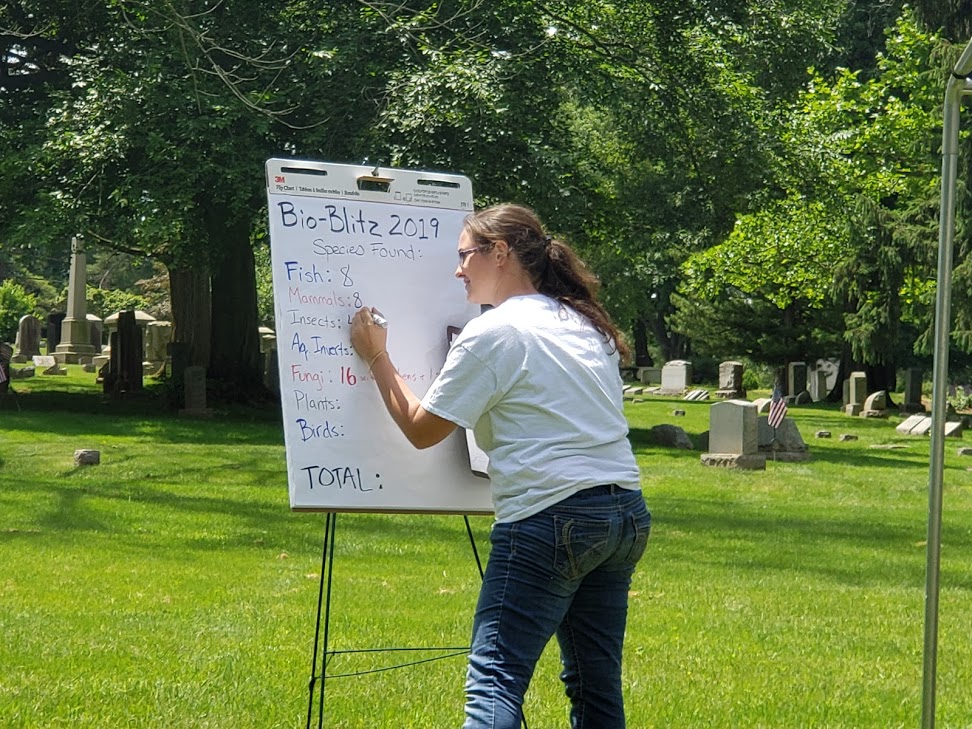
Over 4 dozen area “citizen scientists” and experts scoured the 50 acre site identifying and cataloging the fish, mammals, insects, aquatic invertebrates, fungi, plants, and birds. They identified 8 species of fish; 8 species of mammals; 47 species of insects; 15 species of aquatic invertebrates; 20 species of fungi; 37 species of plants; and 42 species of birds (the latter are catalogued on E-bird: https://ebird.org/nj/view/checklist/S57201308 ) — a total of 177 different species.
Photo credit: Johnny MalpicaPhoto Credit: Johnny Malpica Photo credit: Johnny Malpica
The event inspired many two-way conversations between our community participants and the volunteer scientists. Instead of a didactic “top down” learning experience, both groups shared their knowledge and understanding of the local environment in a way that enhanced the specialized knowledge of the expert scientists, and, in turn, the expert scientists helped community volunteers develop a deeper knowledge and appreciation for the natural world and local environment. The experts’ final reports will be ready in a month; their findings will be shared with the volunteers. Elmwood Cemetery plans to make a Bioblitz an annual event.
Elmwood Cemetery, a Special Forested Habitat Refuge The cemetery is nestled between the New and North Brunswick communities. It was established in 1868 as a “Victorian Garden Cemetery” during the rural cemetery movement, and to this day all of Elmwood’s lanes and paths are lined with evergreens and flowering native trees. Cemetery managers are building on this legacy of careful planning and land protections to secure Arboretum accreditation, which will allow them to further advance the planting, study, and conservation of woody plants and trees in the area.
Enterococci levels are used as indicators of the possible presence of disease-causing bacteria in recreational waters. Such pathogens may pose health risks to people fishing and swimming in a water body. Sources of bacteria include Combined Sewer Overflows (CSOs), improperly functioning wastewater treatment plants, stormwater runoff, leaking septic systems, animal carcasses, and runoff from manure storage areas. Enterococci levels are often high after heavy or consistent rainfall.
Enterococci results are reported in Colony Forming Units or CFUs. Enterococci results are reported in Colony Forming Units or CFUs. Suitable levels should not exceed 104 cfu/100mL.
Enterococcus results, times and coordinates:
Site Name
Time sampled
Enterococcus (CFU)
Riverside Park (40.54067, -74.51219)
10:01
800
Rutgers Boathouse (40.48826, -74.43384)
10:37
520
Edison Boathouse (40.48769, -74.38409)
11:05
250
Ken Buchannan Waterfront Park(40.47483, -74.35586)
11:43
46
South Amboy Waterfront Park(40.48334, -74.2698)
12:13
15
2nd Street Park (49.50007, -74.27719)
12:41
150
TNTC stands for Too Numerous To Count , or >60,000. Please note that these results are in colony forming units (CFU), not MPN. These results are preliminary and pending Quality Control.